Navigating the unexpected deadends and misleading turns of a poorly organized website is never fun. Your website must provide visitors with what they expect to find, whether that’s content, products, or whatever means to whatever end.
And yet, I continue to see websites that seem to be designed to keep users ensnared in an annoying virtual corn maze, complete with dead ends and false trails. One way to make sure your users don’t want to come back to your website is to frustrate them. (Unless that’s the point of your site.)
The fixes are usually fairly simple to employ once you can identify the sticking points. To do so, you must know how to interpret Google Analytics 4 (GA4) data for informed insights.
This article explores how you can use GA4’s path exploration report to help remove website roadblocks for your users.
1. How are new visitors from a specific channel navigating my website paths in a specific browser?
If you’re directing too many people down the same, wrong paths, you will have some unhappy and claustrophobic visitors.
Let’s walk through the steps in GA4 to see how visitors navigate your site and how you can see the ways different segments of people navigate (or fail to navigate) your twists and turns.
- Sign in to Google Analytics.
- On the left, click Explore.
- At the top of the screen, select the Path exploration template.
- To try to help you see what’s possible, Analytics will automatically fill the template with a sample implementation. Click Start Over in the upper right to clear the sample.
- Drag and drop the Event button from Node Type to the Starting Point.
- One benefit of GA4 is the default Events tracked for you without any effort from you required (you can see the full list here).
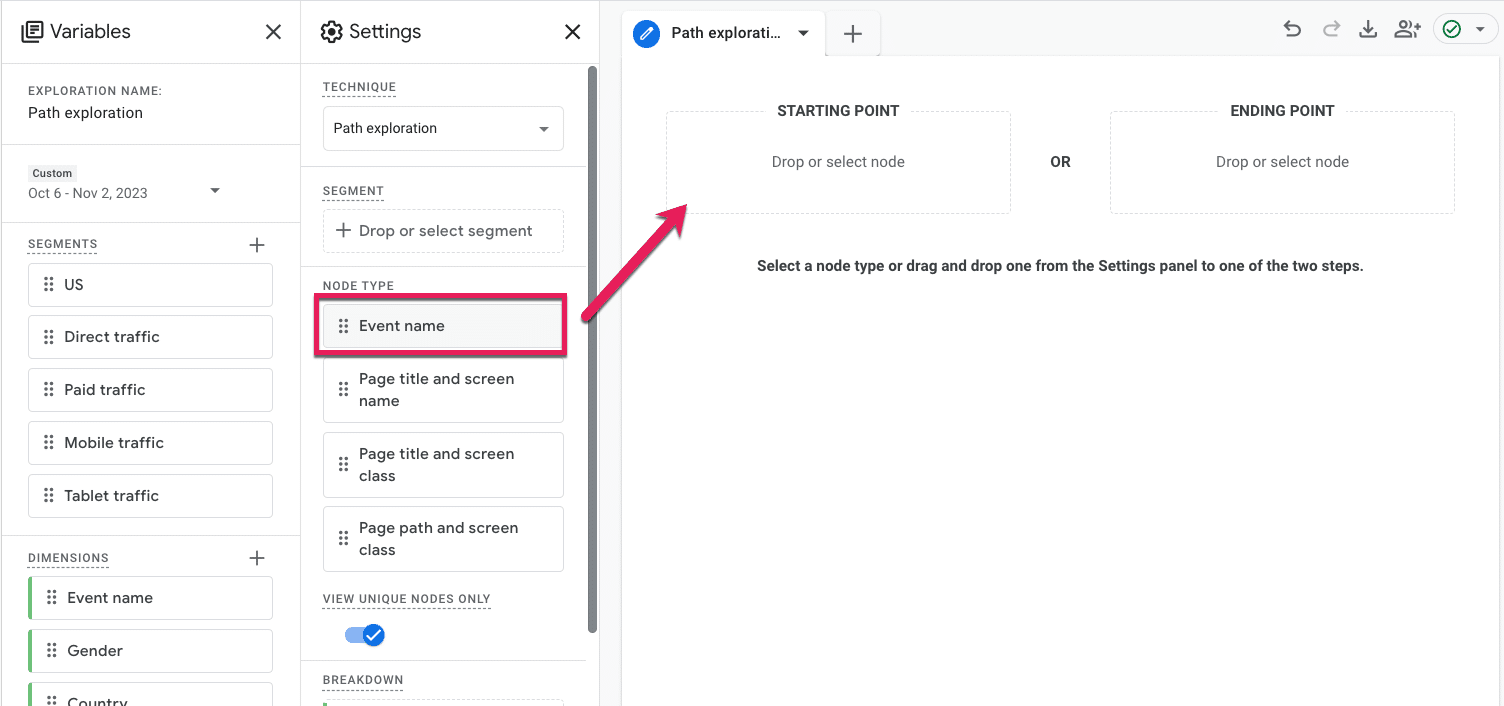
- At this point, a menu will pop up for you to select what Event you want to dive into. Since we’re focused on first-timers, we will select the default Event, first_visit.

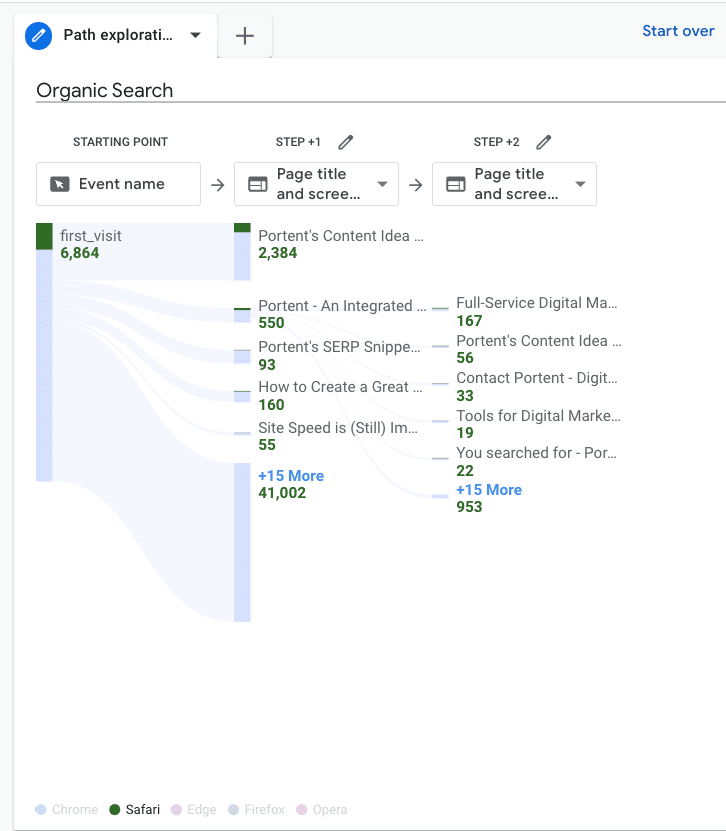
- The report will automatically populate step 1 with the same node type; in this case, the Event. But we’re interested in seeing where first-timers go on our site, so click the drop-down under Step +1 that says Event Name, and select Page title and screen name.
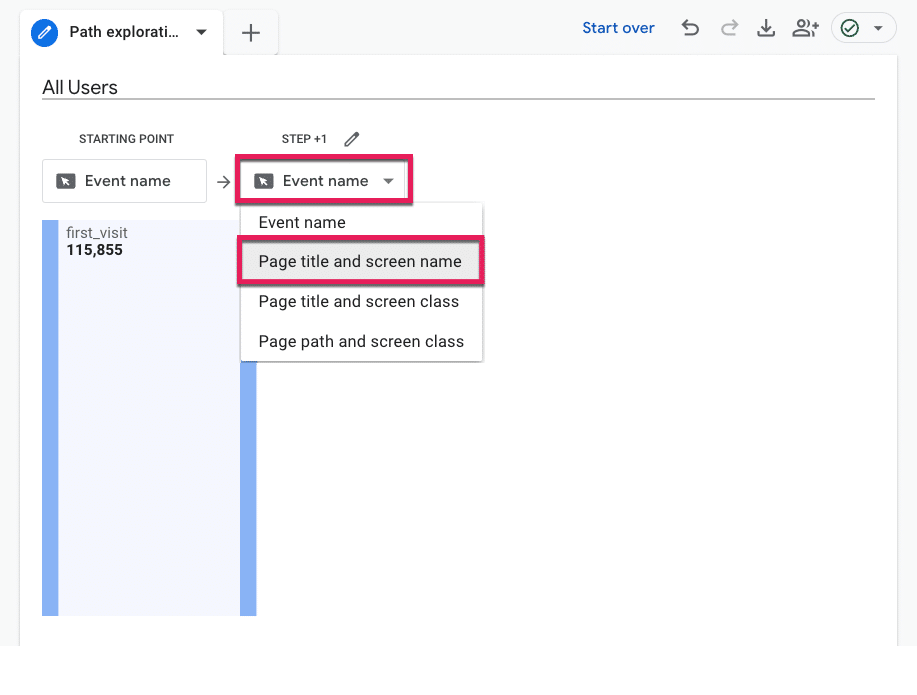
- Now, we can see what pages on our site first-time visitors land on. I’m willing to bet your homepage is pretty high up there, so click that page title to open up Step +2 (a.k.a., what page first-time users to your homepage navigate to).
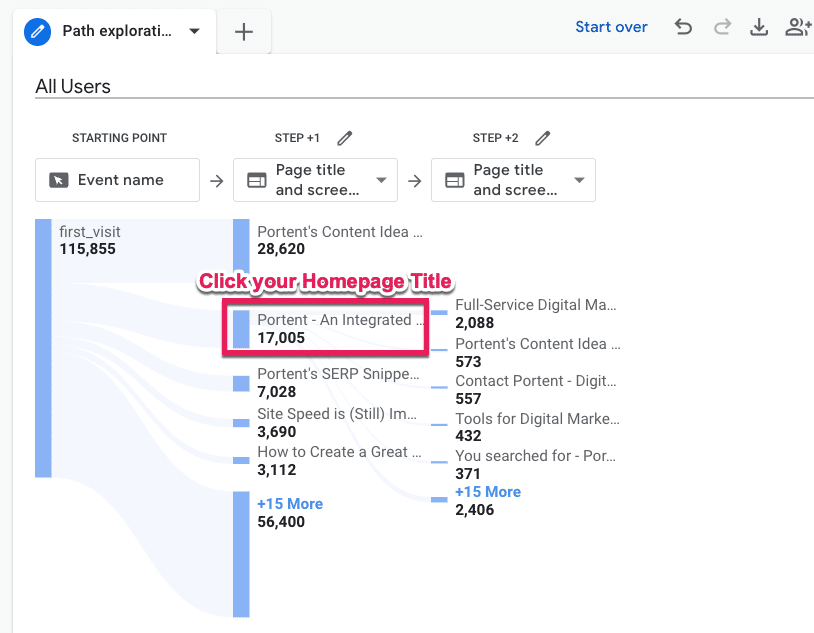
- Measure your feelings. No, really. Are you surprised by what you see? Did you expect first-time visitors to your homepage to make it to a specific product or pricing page that isn’t even in the top five listed in “Step +2?”
- To see specifically Organic Search users subset, we will apply a Segment. Go to the Segments menu under Variables and click the plus (+) icon.
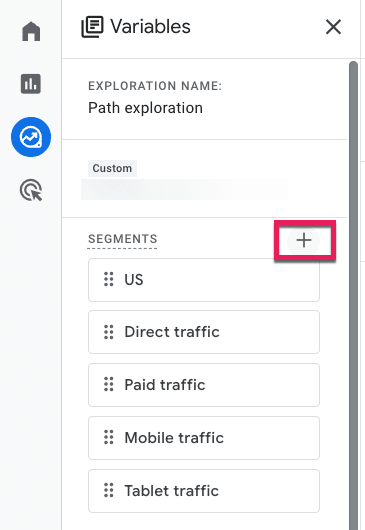
GA4 has a ton of pre-built segments for you to peruse at your leisure, but we will select Templates and then Acquisition.

- From there, those without RegEx experience can collectively release the breath you’ve been holding because now we can select the First user default channel and add a filter that contains a drop-down of default channels. Then click the big blue Save and Apply button in the top right corner.

To see our segment broken down by Browser (or analyzed by any other attribute), follow the last three steps, only this time select the Dimensions variable.

- Check the Browser option from the pre-defined Platform / Device Dimensions GA4 provides, click Import, and then drag and drop that Dimension into Breakdown.
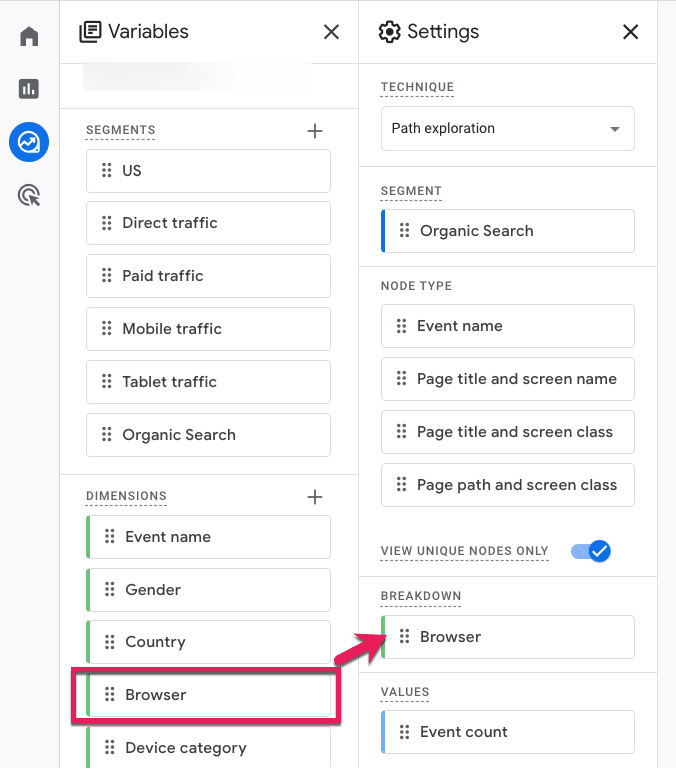
- From there, we can hover over the metrics at the bottom to see how this user path compares by different browsers.
2. What are my non-converting visitors expecting other than what they’re getting?
Is there anything your visitors want that they’re not getting?
Let’s walk through the steps in GA4 to see what users are searching for and how you can prioritize new additions or make existing things easier to find.
- Sign in to Google Analytics.
- On the left, click Explore.
- Choose a blank exploration.
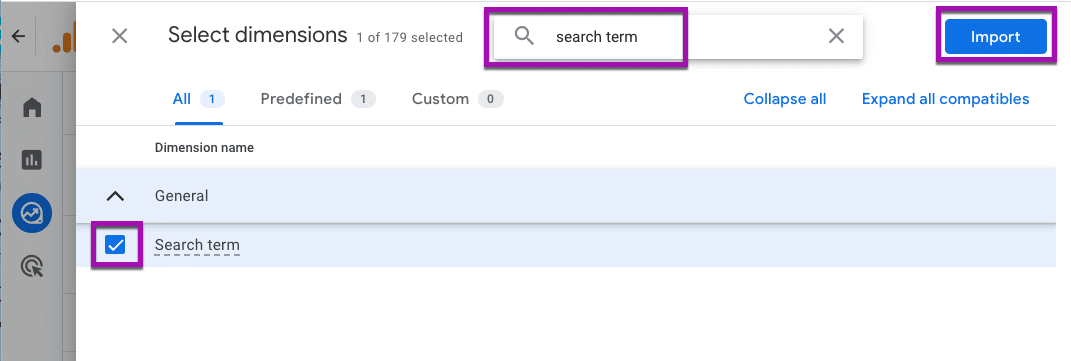
- We’ll need to add “Search term” data to our exploration, so click the + next to Dimensions
- You can explore the Dimensions here, or you can simply type search term into the search bar at the top, click the check box, and add that data by clicking the big blue Import button in the top right corner.
- Now that we know what we want to analyze, we need to specify the specific numbers we’re interested in. Click the plus (+) icon next to Metrics. To see how many users searched for a given term, choose "Active users.” To see how many times those users searched for it, select "Event count." Then, click Import.
- To populate your report, drag the Dimension Search Term into the row and the Metrics into the values.
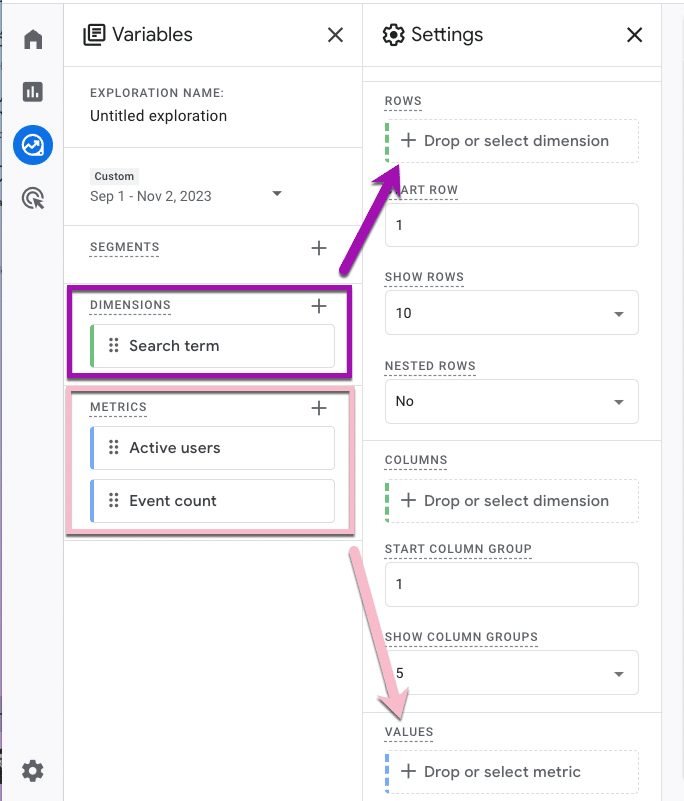
- Your free-form exploration now has data in it. Specifically, Search term data from your on-site search, including how many users searched for it and how many times they searched for it. It’s time to search your feelings again. Is the data what you would expect to see?
- To break out our data by non-converters, add a Segment by clicking the plus (+) icon.
- No need to create a custom segment for this. Google already has prebuilt audience suggestions for us. Go ahead and select the Non-Purchasers audience under the General menu.

- You can see on the next page how that audience was defined, but there’s no need for you to change anything unless you want to. Click the Save and Apply button in the top right, then do the same step for the Purchasers audience.

- Sit with your data for a moment.
- Row 2 is the most searched term for your site. Is it an easy page to navigate to? Based on the data, I would guess “no.”
- Or are you seeing an urgent opportunity to optimize website experiences, like in row 4, where the Purchasers column is 0?
- Row 2 is the most searched term for your site. Is it an easy page to navigate to? Based on the data, I would guess “no.”
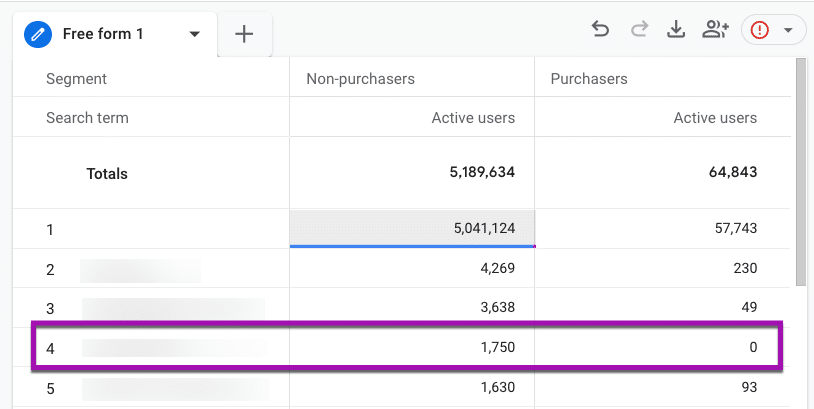
This data tells you that no one searching for the row 4 term is purchasing from your site.
Is that what you expected? Or do you have some content you need to spin up or a Purchasing department to notify?
3. What is the top exited page, and where are those users coming from?
Ideally, everyone who enters should also exit your website, but are they leaving in the right direction?
Let’s walk through the steps in GA4 to see the last pages people visit and what channel those users came from.
- Sign in to Google Analytics.
- On the left, click Explore.
- Choose a Blank exploration.
- We need to select the thing we want to analyze. In this case, we want to know the Page title, and we also want to know the Channel these users used to get there. Click the + next to Dimension,
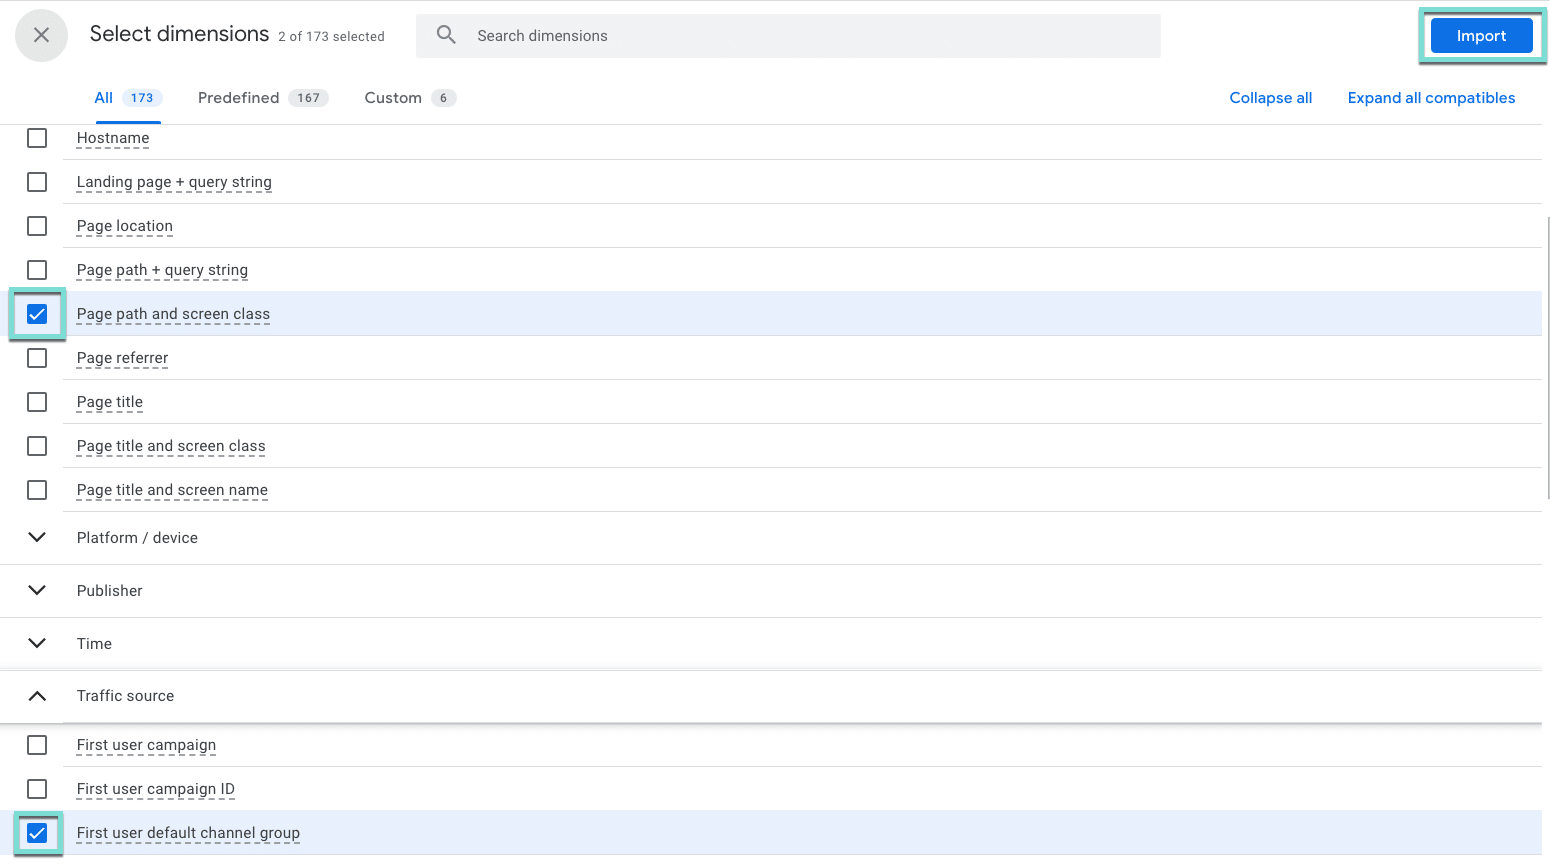
- Select Page path and screen class (under Page/screen), and First user default channel group (under Traffic source), and click the big blue Import button in the top right corner.
- Now, we need to define the numbers we want to look at. Click the + next to Metrics.
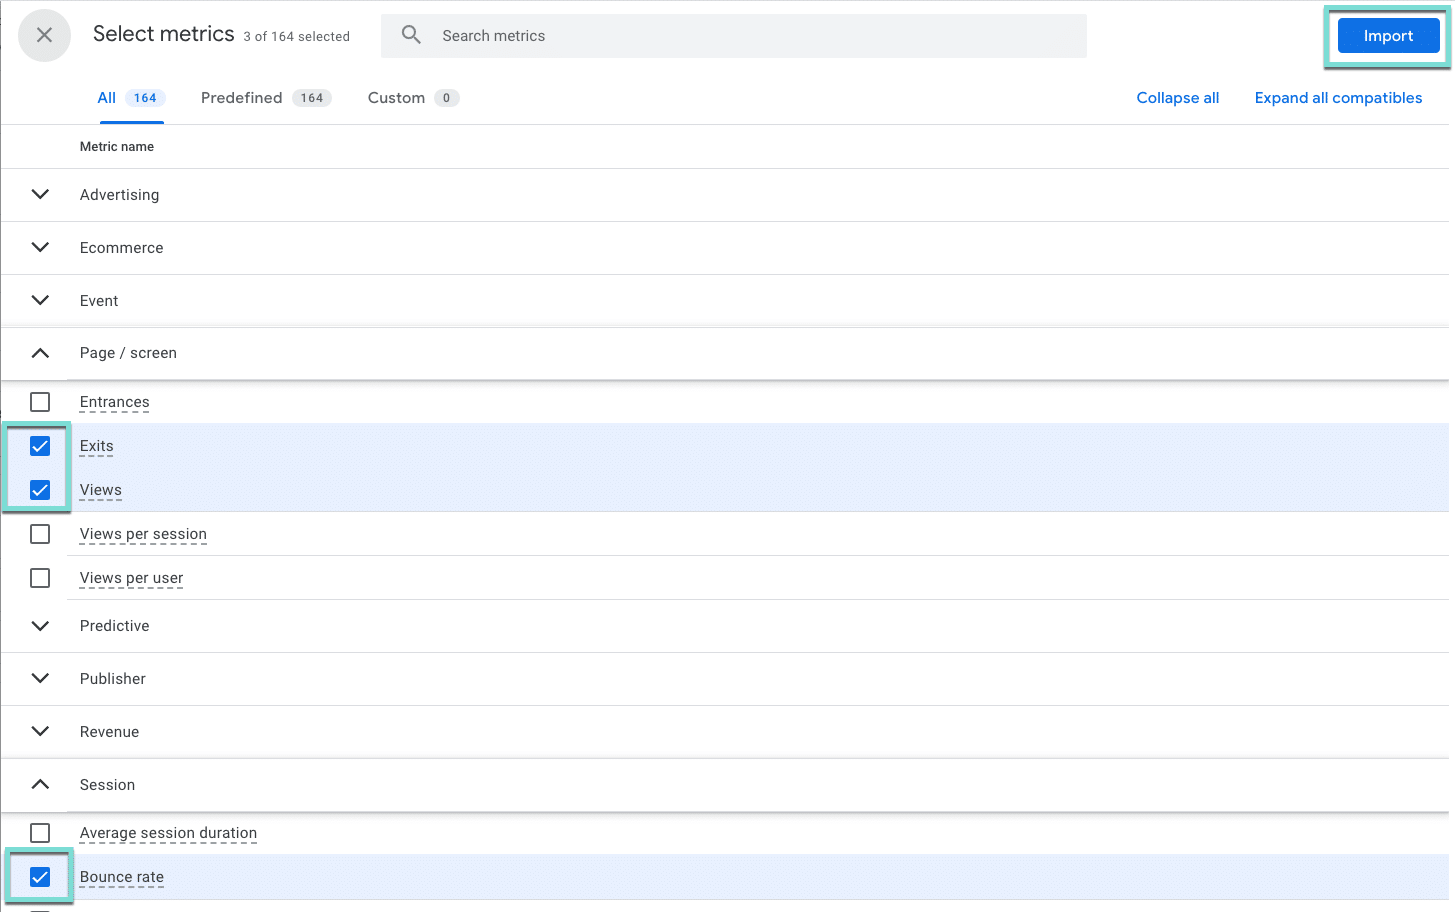
- Using the search bar or by expanding the menus, select Exits, Views, and Bounce Rate, and click the Import button.
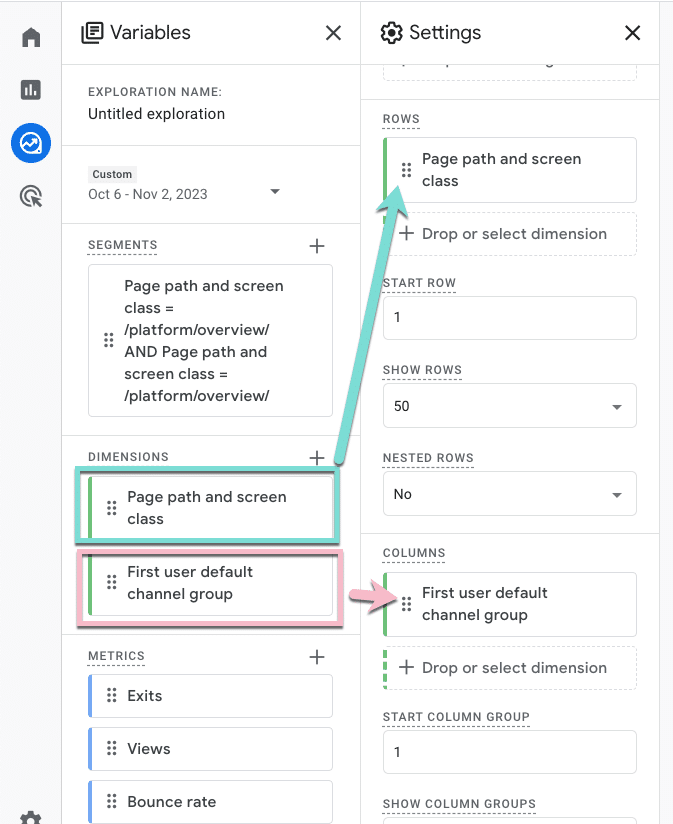
- Drag Page path and screen class into the rows area, and First user default channel group to the columns.
- Then, drag your metrics into the values area. To help us focus on the right things, we will also change the cell type to Heat Map.
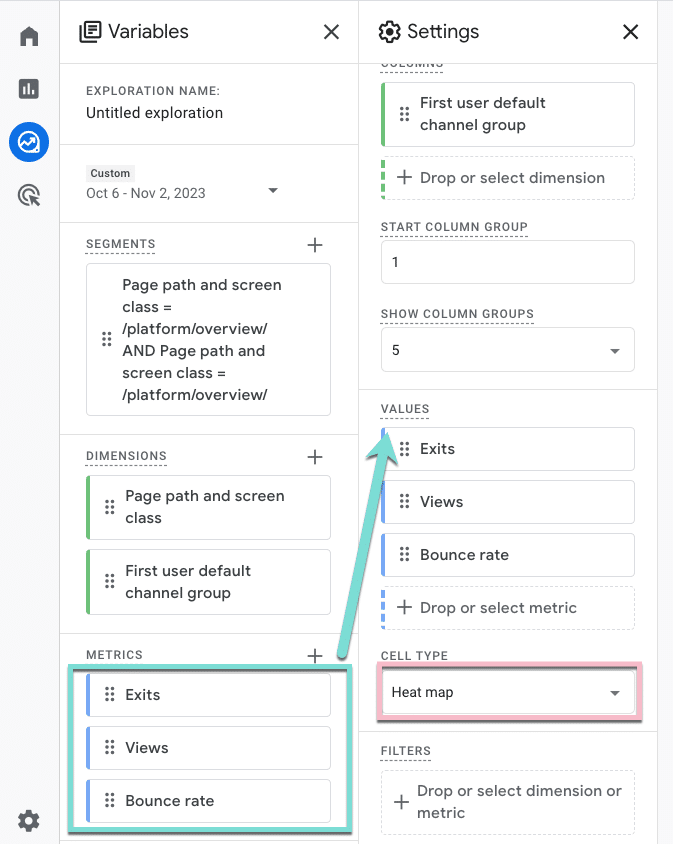
- Now, go ahead and close out Variables and Settings to minimize those menus and see the full report.

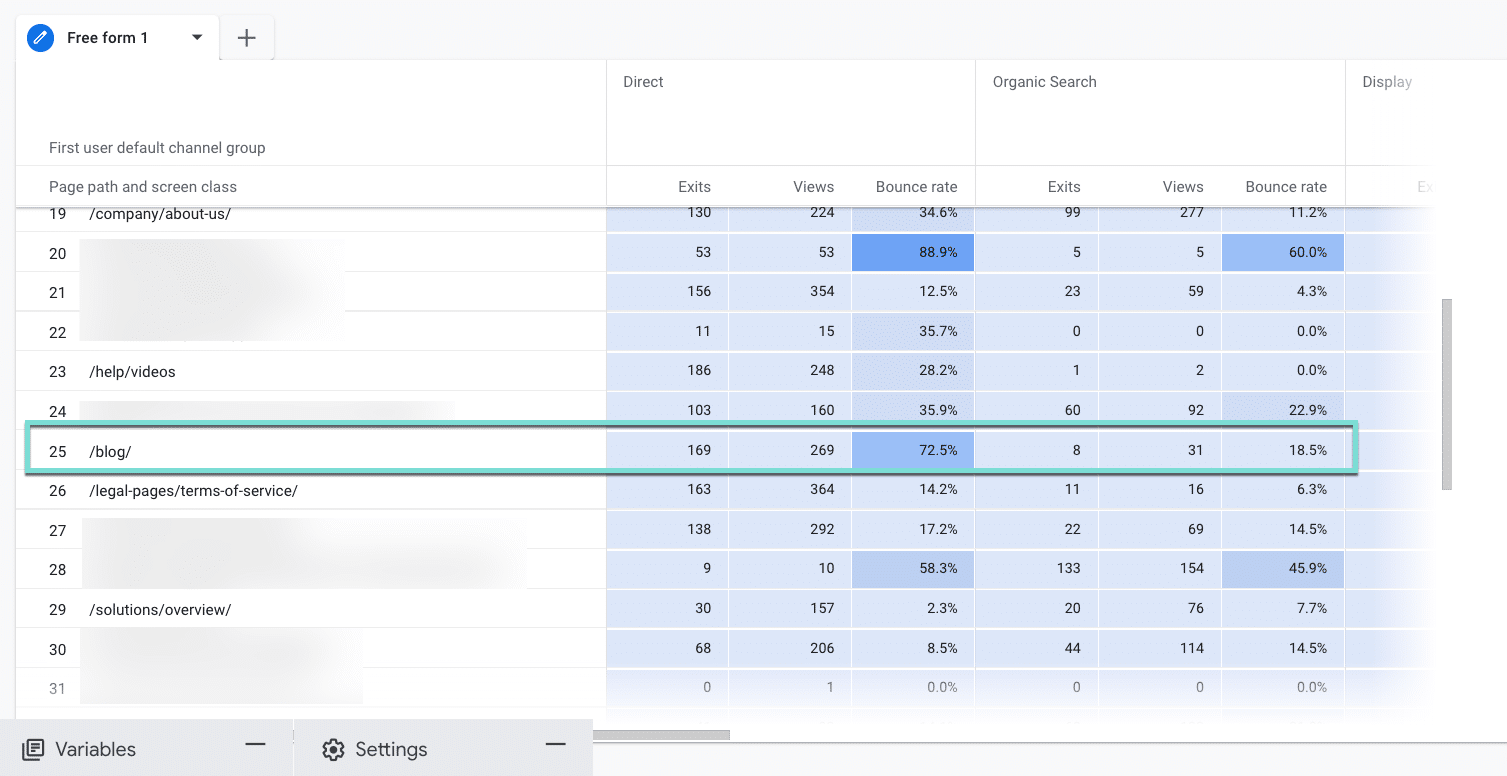
- Examine the heat map and scroll over and down to find the darkest cells that indicate the highest numbers.
- Are you seeing differences by traffic source, like row 25?
- What channels need more attention to improve or optimize event metrics like bounce rate? And why those channels?
- Is the meta description on the Organic Search result setting a different expectation than the one Direct users have when they visit that page?
Enhancing website engagement with GA4
The path exploration report in GA4 can be a game-changer for uncovering and addressing website roadblocks. Leveraging this tool lets you gain insights and take action to enhance the user experience.
Incorporating these insights into your digital marketing strategy can lead to a more user-friendly website, improved engagement, and enhanced overall performance.
Dig deeper: How to use GA4 to optimize your digital marketing strategy
The post GA4 path exploration report: 3 ways to uncover website roadblocks appeared first on Search Engine Land.
from Search Engine Land https://ift.tt/AvPmfbE
via IFTTT
No comments:
Post a Comment