Search

Wednesday, February 21, 2024

Who won: Measuring the most effective Super Bowl 2024 Ads

This year’s Super Bowl LVIII was watched by a record 123.4 million viewers. The Kansas City Chiefs beat the San Francisco 49ers in a thrilling game with a final score of 25-22. 

But beyond the game itself, another competition was happening – determining which of the 59 commercials that aired was the most effective advertisement. 

Analyzing ad effectiveness is a complex endeavor that requires looking beyond just viewership numbers to metrics that measure real business outcomes. 

This article explores different methodologies and key performance indicators used to evaluate Super Bowl commercials, making the case for metrics like engaged-view conversions that tie advertising directly to customer actions and sales.

Measuring ad effectiveness: The top 2024 Super Bowl  commercials

Dome ad agencies may tell their clients that more than 100 million people watched last year’s Super Bowl, so we can expect that even more people may have tuned in to see Taylor Swift kiss her boyfriend, Travis Kelce, after the big game. 

OK, maybe a percentage of this audience missed a brand’s TV commercial because they were in the kitchen getting more snacks. But even if a substantial portion of the Super Bowl audience saw a brand’s spot, which cost roughly $7 million for 30 seconds of air time on CBS, that doesn’t mean it was effective. 

This year’s big game was played in between 59 ads. If you used a brand lift survey to measure metrics such as ad recall, brand awareness, and consideration, then you’d find that only a fraction of the Super Bowl 2024 ads would be considered effective.

That’s why showing up is necessary but insufficient to “winning.”

Nevertheless, I suspect that 10 ad agencies told their clients that they “won” because they were among “The top 10 Super Bowl 58 commercials,” according to USA TODAY Ad Meter. 

Well, kudos to them. Here are the top eight (which got an average rating of at least 6 out of 10):

But digital marketers who know how to measure what matters should remind their brands and ad agencies that USA Today created the Ad Meter’s methodology back in 1989. And in 2024, it said: 

  • Participants: Any U.S. citizen 18 and older can participate as an Ad Meter panelist.
  • Rating System: Each participant rates each commercial on a scale of 1 to 10, with 10 being the highest score.
  • Categories: Some ads are not eligible for Ad Meter, including ads that only run on digital platforms.

So, Ad Meter may not be an accurate “gauge of consumers’ opinions about television’s most expensive commercials.” USA Today says, “We fully expect brands to use social media outlets as a way to promote a campaign.”

Are there better ways of measuring the most effective Super Bowl 2024 ads? Yes, there are.

For example, Kantar used LINK AI tool, which predicts creative effectiveness, to rank this year’s Big Game ads. However, only 12 of them reached “top performer” status based on their priority metrics: Impact, Power, and Enjoyment. Here are Kantar’s top five ads:

Finally, DAIVID used its content testing platform, which includes facial coding, eye tracking, and survey responses, to measure the Super Bowl 2024 ads with the biggest emotional and business impact on viewers. A total of 4,950 U.S. respondents took part in the study, which didn’t include movie trailers.

Here are the 10 most effective Super Bowl 2024 ads:

  • “NFL Super Bowl LVIII || Born to Play,” (7.45).
  • “DON’T FORGET UBER EATS,” (7.23).

Ian Forrester, CEO and founder of DAIVID, said: 

“The NFL’s Big Game spot evoked intense positive emotions among 66.5% of the audience (+29.1% vs. US norm). With the vast majority of ads this year seeking to amuse viewers, the ad stood out by evoking inspiration (29.7%), admiration (24.1%), hope (21.4%), and warmth (21.4%). This outstanding emotional response, combined with strong attention (74.5%, +4.9% vs. norm) and excellent brand recall (83.5%, +20.0% vs. norm), won the ad top honours.”

So, which metrics should digital marketers use?

Or, as Alice asks in Lewis Carroll’s Alice’s Adventures in Wonderland, “Would you tell me, please, which way I ought to go from here?” And, as the Cheshire Cat responds, “That depends a good deal on where you want to get to.”

But clients increasingly want to get farther than the so-called top of the funnel. With Google Analytics 4 (GA4) enabling brands and businesses to measure engaged-view conversions (EVCs), I would advise ad agencies to learn how to track when someone has watched a YouTube video for at least 10 seconds and then converted on their client’s website within three days of viewing the video.


Get the daily newsletter search marketers rely on.


Why adopt this new metric as a KPI of ad effectiveness?

According to Google Ads Help

“YouTube video viewers have strong intent to watch the content they’ve come to YouTube for and because of that, are very likely to stay on the platform when they encounter an ad as part of their viewing experience.” This explains why people often don’t take action directly after viewing a video ad.

However, they often take action after they’ve finished their full viewing session. This explains us why “70% of YouTube viewers say that they bought a brand as a result of finding the brand on YouTube.”

This is where EVCs come in. They are counted when a user watches at least 10 seconds of a skippable in-stream ad (or watches the entire skippable in-stream ad, if it’s shorter than 10 seconds) and then converts within the EVC window.

Brands and their ad agencies couldn’t measure that back in 1989 when the Ad Meter’s methodology was created. If they could have, then I’m confident that my father, who was director of marketing at Oldsmobile then, would have used this KPI to measure the impact of his classic campaign, which proclaimed, “This is NOT your father’s Oldsmobile.” 

Ironically, it was my father’s Oldsmobile. I learned a painful lesson from my dad that has dramatically influenced my choice of marketing KPIs for more than 35 years:

Measure outcomes, not outputs.

The typical business model for ad agencies in the late 1980s was built on how much media they bought on behalf of their clients.

So, most ad agencies used gross rating points (GRPs) to measure the size of an audience reached by a specific ad campaign.

GRPs were often used in the context of television advertising, where they represented the total number of impressions (the number of times an ad was shown) generated by a specific television schedule.

Now, automotive marketers need consumers to:

  • Be aware of their brand. 
  • Have a favorable opinion of their brand.
  • Consider buying their brand.
  • Intend to purchase the brand the next time they’re in the market. 

So, sometimes, the agency’s focus on metrics like GRPs is aligned with the client’s goal of brand awareness, favorability, consideration, and purchase intent. 

But sometimes it’s not. Why? Because it is a myth that all advertising increases sales to some degree. It doesn’t.

As David Ogilvy observed in his classic book “Ogilvy on Advertising,” the wrong type of advertising can hurt sales. He referenced a survey showing lower beer consumption among people who recalled its ads than those who didn’t. In effect, “the brewer had spent millions of dollars on advertising which un-sold his beer.”

My father also learned this painful lesson when his classic ad campaign, which proclaimed, “This is not your father’s Oldsmobile,” un-sold 62.5% of his target audience in less than five years. 

Oldsmobile ad

Before the ad campaign was launched, Oldsmobile had sold 1.2 million cars in 1986, making it the third leading car brand in the U.S., behind only Chevrolet and Ford.

His ad campaign featured celebrities like William Shatner and Ringo Starr driving a new Oldsmobile with their daughters.

The ad campaign made the phrase, “This is not your father’s Oldsmobile,” a meme that many older consumers still recall today. But Oldsmobile’s sales fell to 900,000 in 1987, 800,000 in 1988, 700,000 in 1989, 600,000 in 1990, and 450,000 in 1991.

During this time, my father asked his ad agency, Leo Burnette, how they measured the ad campaign results. They answered, “GRPs.” This prompted my father to ask them, “How many GRPs do we need to sell a car?”

Now, General Motors had many other problems, so it filed for bankruptcy in 2009 and closed several brands, including Pontiac, Saturn, and Hummer.

But Oldsmobile’s 107-year history ended five years earlier in 2004. So, I’d argue that measuring the results of an advertising campaign using GRPs knocked about five years off the life of GM’s second most popular brand.

So, the lesson that I learned from my dad is to measure outcomes, not outputs. And it’s one that I’d like to share with digital marketers in 2024. I’m just paying it forward. 

Dig deeper: SEO outcomes vs. SEO outputs: Understanding the difference


from Search Engine Land https://ift.tt/WbpJicO
via IFTTT

Tuesday, February 20, 2024

Article complaining about being outranked on Google being outranked by Reddit

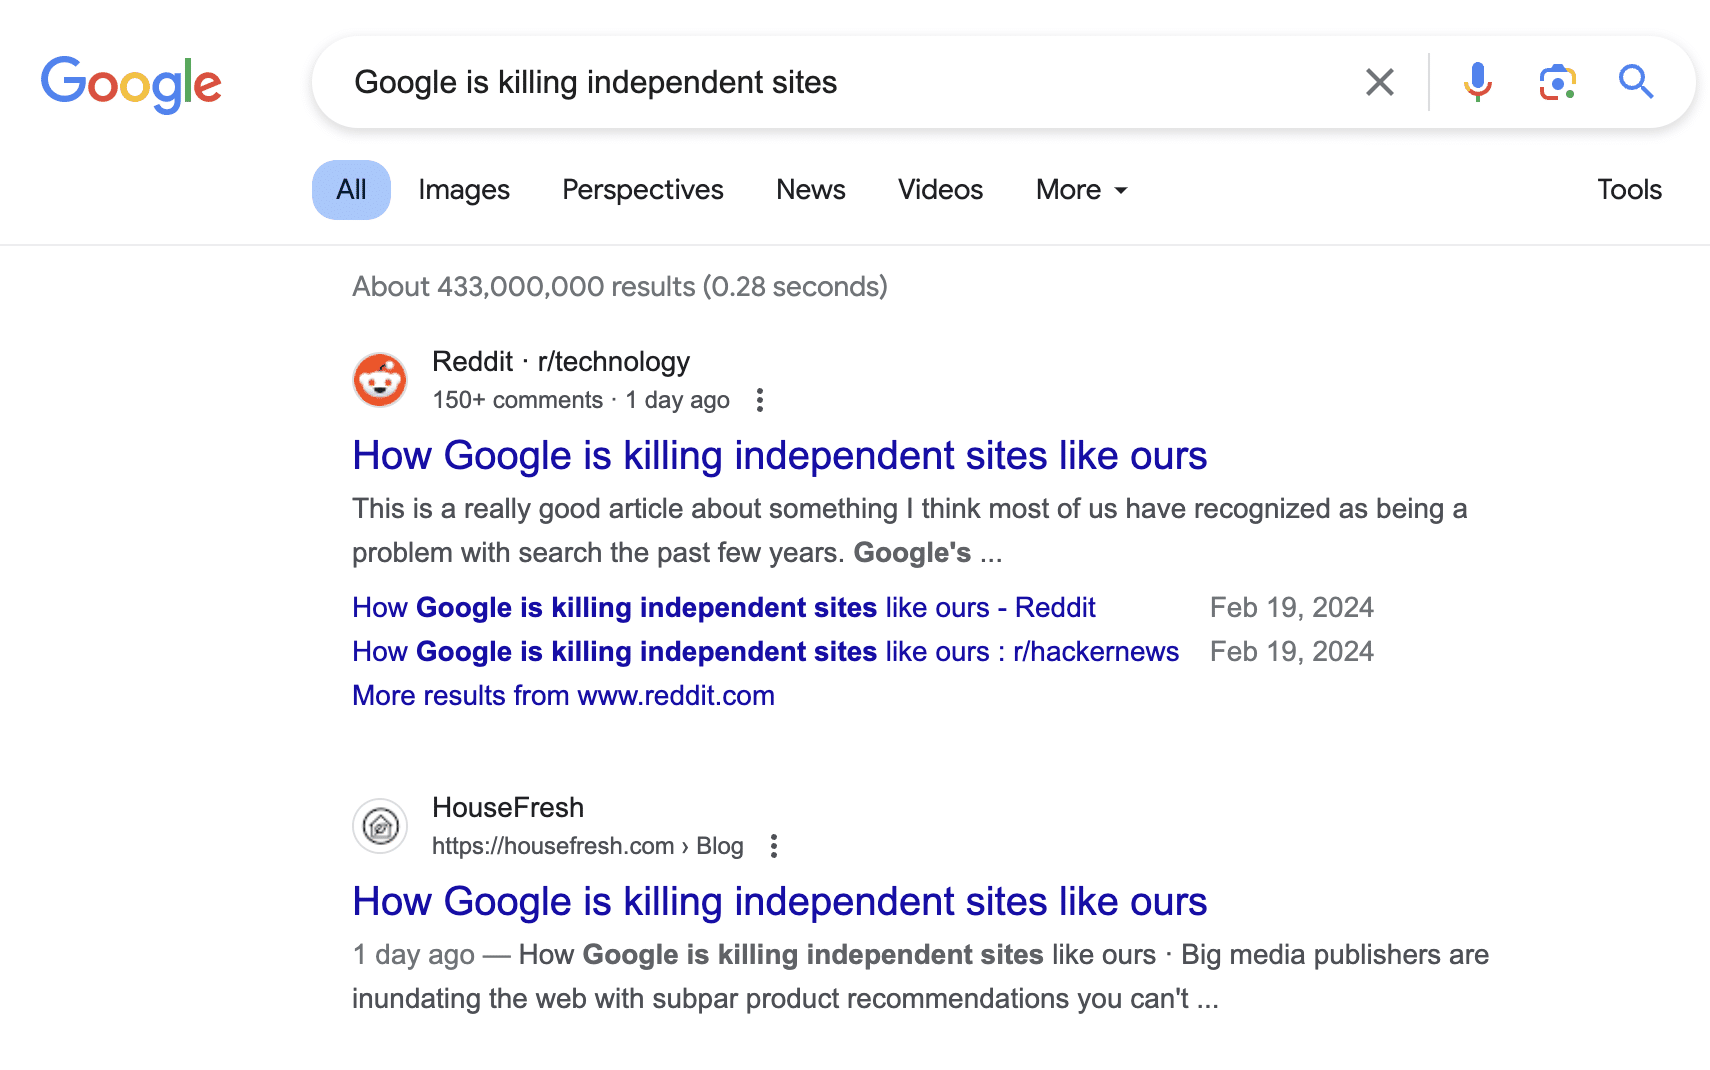
How Google is killing independent sites like ours from HouseFresh talks about an ongoing complaint from smaller publishers and site owners about how they are constantly being outranked by larger publishers and site owners in Google Search. The irony here is that story is currently being outranked by Reddit – no joke.

Google ranking Reddit above HouseFresh. Here is a screenshot for a search on [Google is killing independent sites] where Reddit, a large popular forum, is outranking the original site that published the content, HouseFresh, for its own article. And the Reddit post links to the original story!

The issue. The complaints are not new, Google has been fielding complaints about large sites outranking smaller sites for a couple decades now. Former Googler, Matt Cutts, even posted about it a decade ago, asking for site owners to post examples of smaller sites that should rank better.

But often enough, smaller publishers are right and they should rank higher than they are. This is not in all cases, but in some cases, where the content is better, from the original source and have all of those helpful content and EEAT elements, why should Reddit outrank that piece.

Google responds. Danny Sullivan, Google’s Search Liaison, said, “my thoughts that I’d like to see us do more to ensure we’re showing a better diversity of results that does include both small and large publications.” “I hope we’ll be doing better in the future for these types of issues,” he added.

He later wrote:

As for the broader question of, let’s call it, “big site versus small site,” I’ve also raised this concern over the past weeks, because it shouldn’t be that way (and it’s not always, either). But yes, we should be rewarding the best content, regardless of site size. As I said, I hope we’ll get better here.

Irony. The irony here of Reddit outranking this story from a smaller publisher is just a bit over-the-top. Especially since that Reddit post links directly to the original story from the smaller publisher.

The article even wrote, “After Google’s latest Helpful Content Update, Reddit and LinkedIn started ranking heavily in Google search results. If you want to find out more about Reddit specifically, you should read this article from Glen Allsopp.”

Why we care. Does this mean smaller publishers are doomed and won’t be able to rank well in Google Search? No. Does it mean it will be harder for smaller publishers to rank higher than larger publishers? Not necessarily.

But if you think about it, it isn’t too far off from a small mom-and-pop home improvement store trying to compete with Home Depot down the block. It is possible, you can earn your niche and do well, but it isn’t easy.

That being said, Google has been making promises for decades to provide a more diverse set of search results for smaller publishers but has it delivered? Will Google ever be able to deliver on that promise? Is it even a promise that Google wants to deliver on? Does the searcher care if they read it on Reddit or on the original site? Does Google care?

For many smaller publishers, we sit here and wait for Google to release a new search algorithm update that we hope resolves some of our complaints. When Google does release that update, we will, of course, write about it here.


from Search Engine Land https://ift.tt/luHmtBj
via IFTTT

Experience a key factor during Google algorithm updates, analysis finds

Websites using first-person pronouns, first-hand experience and a cookie consent banner were more likely to see positive visibility gains during Google updates, according to a new correlation study from Zyppy SEO.

Meanwhile, fixed footer ads and fixed video ads were two features that were likely to negatively impact websites.

Why we care. Credibility and experience are becoming increasingly important elements of SEO, in my opinion. As the analysis by Cyrus Shepherd put it brilliantly, “everything in SEO connects to everything else.” This doesn’t mean you’ll always win for every keyword you want, but it will greatly increase the odds in your favor.

Google update winners. Five websites features had a “strong” correlation among winners during Google algorithm updates:

  • Usage of first-person pronouns (e.g., “me,” “I,” “we”). This was based on analyzing the first 1,000 words of text.
  • Demonstrated first-hand experience. This was done either via description within the text or unique imagery or video content.
  • Display of a cookie consent banner.
  • Contact information appeared in the footer.
  • Contact information appeared somewhere on the page but not the footer.

Google update losers. Twelve website features had a “very strong” or “strong” correlation among the winners of Google updates during the same time period:

  • Having fixed ads in the footer that scrolled with the user.
  • Having fixed (auto-play) video ads.
  • Usage of stock imagery. This one seems to fall into the “correlation is not causation” category.
  • The total number of image and video ads appearing (one loser had a whopping 38 ads).
  • Usage of push notifications.
  • Presence of a “large navigational menu at the top of the website, usually expandable, containing a large number of links.”
  • A logo was missing or hidden.
  • A search function appeared in the footer.
  • No contact information appeared on the page.
  • Usage of a mega menu anywhere on the page.
  • Presence of affiliate links.
  • Had a link to a privacy page.

What these all have in common? It call comes back to experience and, ultimately, credibility. These all relate back to content creators demonstrating their own expertise or the website providing a great user experience.

  • Google wants to reward sites that excel in both areas. And yes, we all know Google is not perfect and likely never will be. Search remains an “unsolved problem,” as Marissa Mayer once put it.

About the data. This is a small sample size (50 websites), based on Ahrefs estimates, during a particular volatile period of Google (August to December 2023). Also, correlation is not causation.

Features, not factors. Also, just to be clear, this report does not call any of these website features direct “ranking factors” or “ranking signals.” While the results are interesting, they are not definitive proof that these individual website features could be credited or blamed for any Google Search visibility gains or losses.

The report. You can read it here: Winning & Losing Big Google Updates: 50-Site Case Study


from Search Engine Land https://ift.tt/ehrRnf9
via IFTTT

SEO for user activation, retention and community

SEO has traditionally been viewed as an acquisition channel, focusing on ranking websites to generate more traffic and leads. However, the role of SEO can extend far beyond just acquisition. 

This article explores how SEO can strategically influence user activation, retention, and community building to drive long-term growth and customer loyalty.

The role of SEO in user activation

By definition, user activation is the moment when a user achieves value. This is typically after a user has converted, whether it be paid or trial, but their objectives have been met.

To successfully activate, users need their expectations to be met by the product or service delivery.

This means that our website content needs to allow users to adequately and accurately forecast their potential experience with your company. This is where the concept of “experience forecasting” comes into play.

The idea is built on the premise that search engines evolve to focus more on satisfying the user’s objective, rather than just keywords. 

Experience forecasting aims to match SEO efforts with user intent, entities, and the concept of E-E-A-T, creating more targeted and effective content to address a user’s problems and possible objections to buying.

A good example of this in practice can be seen in the travel sector. 

Detailed descriptions, images, and user-generated content (UGC) help potential visitors to imagine their stay, activities, and overall experience in a destination. 

By considering imagery, feature presentation, descriptions, user reviews, and external factors (e.g., weather expectations, seat limits, file types), companies can align user expectations with the delivered experience.

Content that does this doesn’t try to sell your product/services to users but instead helps them buy.

Community SEO for retention

Historically, community was a byproduct of customer service and product-led growth strategies, and not its focal point of growth and user retention.

Retention can mean two things when we talk about it in the context of SEO and marketing.

We can refer to it either as retaining a customer and preventing churn or keeping a user active in returning to the website and consuming more content during their passive buying and research phases. 

The more positive brand touchpoints we can create with users, the more likely they are not to churn and become brand advocates.

The connection between SEO and retaining customers is crucial but often overlooked, and from experience, it is super important for long-term growth.


Get the daily newsletter search marketers rely on.


Community SEO and content

Community as a concept offers brands a value differentiation point against competitors, especially in industries where, for the most part, products and services are homogenized or feature tick-boxes. 

They can act as both a deterrent to customer churn by providing additional value on top of the actual service they engage with and a great defensive SEO strategy against new market competitors.

A defensive SEO strategy is focused on protecting a website’s current rankings and safeguarding it against potential threats that could negatively impact its search engine visibility and organic traffic, such as Search Generative Experience and other major SERP changes.

This dynamic has changed recently after several Google updates saw Reddit and other forums skyrocket in organic visibility. This has seen the investment in communities increase, but for some it has just been the creation of a forum.

While this is a positive first step, simply creating a forum and community functionality doesn’t equal or generate a community.

For a community to flourish, members need to be able to interact and engage as freely as possible. This means putting in place streamlined content submission processes (with appropriate levels of moderation) so there is no friction and contributing doesn’t feel like a chore. 

As a community becomes more established and users feel more prestige in contributing, this is when you can begin to be more structured around new contributors.

Cloudflare has a great example of community content and has constructed a considerable community content moat around its brand. 

There are many competitors in Cloudflare’s space, and the technologies can be quite hard to distinguish for a high percentage of their target total addressable market (TAM) – but the community provides a value differentiator and added value for users.

From an SEO perspective, it also doesn’t hurt the community. subdomain ranks for approximately 166,000 search terms and has more than 70,000 backlinks, contributing to the overall success of the SEO program.

Redefining the role of SEO for sustainable engagement

As search engines continue to evolve and develop more and more AI-powered features, how we can use content and SEO to create a value differentiator creates the difference between low-quality content (that is now being scaled thanks to AI), and genuine added-value content.

The view that SEO, and content as a product of SEO, is just an acquisition channel is evolving to show how SEO can play a more holistic role in the marketing function, fostering customer loyalty, advocacy, and engagement.

Companies that recognize and adapt to this shift will be better positioned to thrive in the competitive digital landscape, turning casual visitors into loyal customers and brand advocates. 

This also contributes to the notion of E-E-A-T

Companies with a more relatable and immersive brand experience – regardless of whether a user is actively buying, researching, or an existing customer – create resonance and trust.

This is a compelling growth opportunity and defensive SEO strategy to combat AI and changing SERPs. This is an opportunity to redefine organic growth strategies, emphasizing sustainable engagement and long-term value creation over short-term acquisition metrics.


from Search Engine Land https://ift.tt/MiugH70
via IFTTT

Video search optimization: Top tips for 2024

The SERPs of 2024 are certainly not what they were a few years ago, and they’re due to change even more in the coming months as Google aggressively rolls out SGE.

Defining an SEO strategy to capture SERP real estate is increasingly complex due to recent additions like SGE, rich snippets, and other features.

Surprisingly, video search optimization, a method to dominate real estate, remains underutilized.

Let’s look at a quick how-to fitness-related search to see video’s SERP dominance in action:

How to do a burpee - Video search result

Reason enough to keep reading, right? Well, there are two main approaches for hosting your video – YouTube and self-hosting – and each requires a different set of optimization techniques. 

This article compares YouTube to self-hosted video, highlights key optimization factors for each, and discusses strategies to extend your video content‘s reach beyond views.

YouTube video optimization

I’ll start with this option because it’s the one I recommend my clients use for one simple reason: you get the benefits of organic search on both Google and YouTube.

Another pro of YouTube hosting is that it’s easy to upload videos on the platform – much easier, anyway, than embedding them into your owned media, which you have to do with self-hosted videos. 

YouTube also bears the brunt of storing the content, while self-hosted videos can take a toll on site speed and processing power.

YouTube optimization relies on a few major factors: 

  • Keyword research that lets you feed Google the right signals to show up for related queries.
  • Video page optimization, including headlines (the most important factor and one that should include your top keyword), descriptions, tags, and thumbnails. 
  • Video structure that enables watch time signals; and
  • Watch time optimization means that videos with longer watch times may rank more highly – so the content should be compelling.

One of the things I like to remind my clients to do for YouTube optimization is to build a good YouTube channel subscriber list, so when you launch a video, you can get subscriber engagement early on.

Dig deeper: How to audit your YouTube channel for brand success

Self-hosted video optimization

The big benefit of self-hosting your videos is that you have full control of the branding and cookies, which YouTube hosting compromises somewhat. 

That can carry different levels of importance depending on brand priorities, but YouTube’s audience is generally a more powerful consideration.

Self-hosted video optimization relies on some traditional SEO practices, like structured data and sitemaps and making the video crawlable and eligible to rank in video search features on the SERP (as explained in these Google guidelines).

Veteran SEOs should have a few issues translating their skills from other content forms to video SEO.


Get the daily newsletter search marketers rely on.


How to leverage video to its fullest

Use it to spin out content

You’ll notice I haven’t claimed anywhere that creating videos is easy (although AI is certainly producing options to make it easier). Anytime you invest in video (especially longer-form video), make sure you’re using it to produce a full range of content.

A couple of use cases I love to recommend include:

  • Picking any of a number of free software services to provide a translation for your video (if you’re going with YouTube video, YouTube will automatically create a transcript). Feed the transcript into ChatGPT and ask for some kind of blog content (as always, with ChatGPT, you’ll have to refine your queries to get what you want, then ruthlessly edit the results). 
  • Using highlight clips from your video in discrete social media posts and tag any guests to extend reach. If you have enough quotes to highlight from those, pull them out into a “10 top moments from {video} blog, which you should then add to your next newsletter.

In those and similar cases, make sure you’re embedding the video where it makes sense so you can capture more video views.

You can do this with either YouTube or self-hosted videos. This creates a virtuous cycle of content (e.g., video content translated into a blog with the embedded video).

Use the video in your email campaigns

Adding video to your emails does more than just make the content engaging; it makes users more likely to check out the content in the first place. Simply adding “VIDEO” to your email subject lines increases open rate by almost 20%, according to Covideo.

Monetize the video

If it’s hard to track view-through performance and impact in paid media, you can correctly guess that it’s even harder for organic video. 

But you can use links (ideally shortened links with UTMs from a tool like Bitly), either in: 

  • The YouTube description.
  • Content close to a self-hosted video.

This helps people find landing pages or product pages that are a natural extension of the user journey. (For instance, a running shoe store might create a video showing “best shoes to correct pronation” and add the link to the top-selling model in the video.)

If your priority is to drive leads or revenue with your video, you can always sacrifice organic performance by gating it. Or you could try adding it in full to your YouTube channel, writing a blog post and including a snippet, then asking the user for an email for the full video link (and hoping the user will do that instead of searching YouTube – hey, it can work). 

Ultimately, video’s primary function will be to increase brand awareness, measured by an increase in brand search. While the above tactics can help video push people toward purchase, good video campaigns usually lead to more brand searches first, then conversions. 

Check things like video views, YouTube search trends (you can see a mapping of video watch time per keyword), and related upticks in brand search trends and corresponding conversions, and you’ll have at least some directional data on revenue impact.

Maximizing video’s impact for better search visibility

Ultimately, I view video optimization as a smart strategy for hedging against any negative effects from the fast-evolving SERP. 

Start with great content that will keep users’ eyes on the screen, pull some levers to help your content show up when they need to see it, and you can afford to be a little less worried about the impact of SGE’s evolution.


from Search Engine Land https://ift.tt/BLZdIRe
via IFTTT

How to improve and monitor Interaction to Next Paint by DebugBear

Google has announced that the new Interaction to Next Paint (INP) metric will become one of the three Core Web Vitals metrics on March 12, 2024. It’s replacing the older First Input Delay metric.

This marks the biggest change to the web vitals since Google first introduced them as a ranking factor in 2021.

What is Interaction to Next Paint?

The three Core Web Vitals metrics each measure a different aspect of the experience users have on your website. INP assesses how quickly your website responds to user interactions.

For example, if a visitor clicks on a button on your website and it takes a second for the updated page content to render, that represents a poor user experience.

Interaction to Next Paint measures how much time elapses between the user interaction and the next time the browser can update the content on the screen. The more CPU processing is required to handle the interaction and display the new content, the worse the INP score will be.

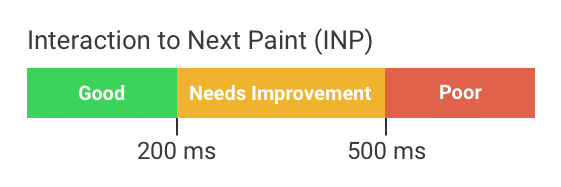
INP score rating

Does Interaction to Next impact Google rankings?

Google has confirmed that the Core Web Vitals are a ranking factor. That means if your site does worse on the INP score, it may rank lower than competitors that do well on all three web vitals metrics.


To get a good score, the INP should be below 200 milliseconds. A delay of over 500 milliseconds is considered poor. Your SEO is gradually impacted as INP worsens between the Good and Poor thresholds.

How does Google know how fast your website responds to user interactions? This data is collected from real Chrome users as part of the Chrome User Experience Report (CrUX).

Interaction to Next Paint diagram

How to test Interaction to Next Paint on your website

Want to find out how well your website does on the INP metric and other Core Web Vitals? Running a free Core Web Vitals test on your website is one quick way to check. Just enter a page URL and wait for the test result.

The real user Interaction to Next Paint data can be found in the Web Vitals tab. The 25-week trend lets you know whether the page is getting better or worse over time.

The data that’s shown here comes from the Google CrUX report.

Google CrUX data history

To get a broader view of different page groups on your website, you can also check the Core Web Vitals tab in Google Search Console. Here you’ll see how many pages are affected by INP issues or otherwise don’t pass the Core Web Vitals assessment.

Interaction to Next Paint in Google Search Console

Unfortunately, the data Google provides isn’t very nuanced, and due to the page grouping mechanism, you may not be able to tell which specific pages are impacted by slow Interaction to next Paint.

Google CrUX data is also aggregated over 28 days. That means you’ll have to wait several weeks to see the impact of any optimizations.

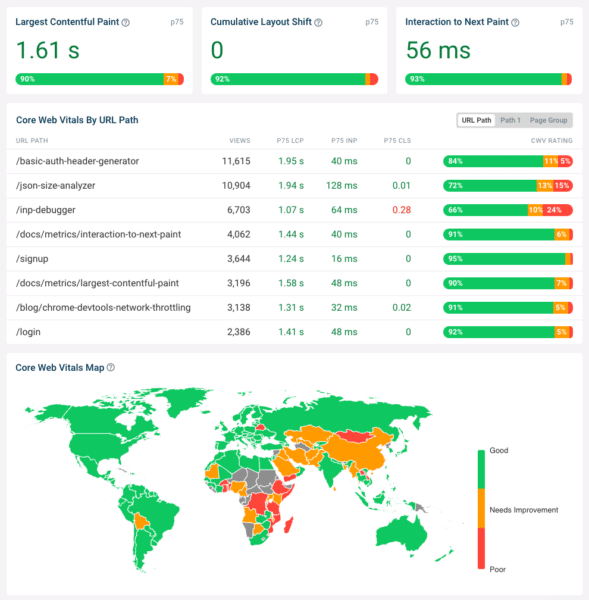
To get more in-depth insight, a dedicated real-user Core Web Vitals monitoring tool like DebugBear can help. This way, you get detailed Core Web Vitals data across your whole website, updating as soon as a change is rolled out.

DebugBear Core Web Vitals dashboard

How do you speed up interactions and improve INP?

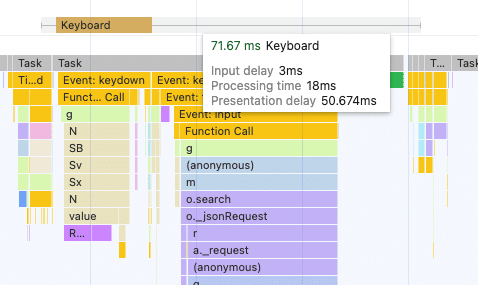
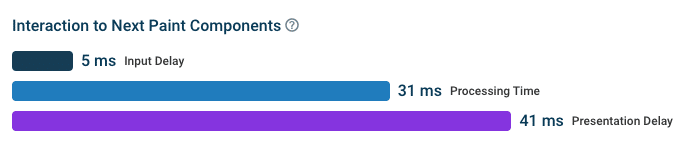
To improve INP scores on your website, you need to know what CPU processing is involved in a user interaction. INP can be divided into three components:

  • Input delay: background tasks that prevent the browser from handling an interaction until after the tasks are complete
  • Processing time: running code that handles the user interaction and schedules updates to the user interface
  • Presentation delay: after UI updates are scheduled, the browser has to update the page layout and present the new content

The performance tab in Chrome DevTools shows how long interactions on the page took and what was responsible for the CPU processing.

INP in the Chrome DevTools Performance tab

The data in the DevTools performance tab can be hard to read, so you’ll usually want a developer involved. But it provides an explanation for every millisecond that the browser spends while handling the event.

For example, you may find that:

  • Third-party code is running in the background and slowing down interactions.
  • The JavaScript code your website runs in response to an interaction must be optimized.
  • You can schedule CPU tasks more efficiently to reduce the time that interactions are blocked.

Real user monitoring with DebugBear will show you which INP component contributes the most to poor responsiveness on your website.

INP component breakdown

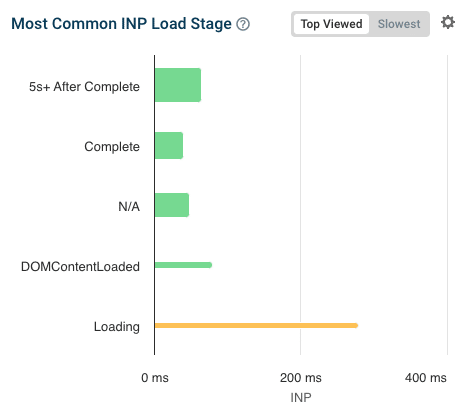
You’ll also often find that interactions take longer during the initial loading process of the website. That’s because when a page first starts loading, many small tasks are run in the background to set up the page, for example, loading ads or initializing a form or chat widget.

DebugBear shows a breakdown of how fast interactions are at different stages and how frequently interactions occur in these time periods (indicated by the height of the bar).

INP load stage breakdown

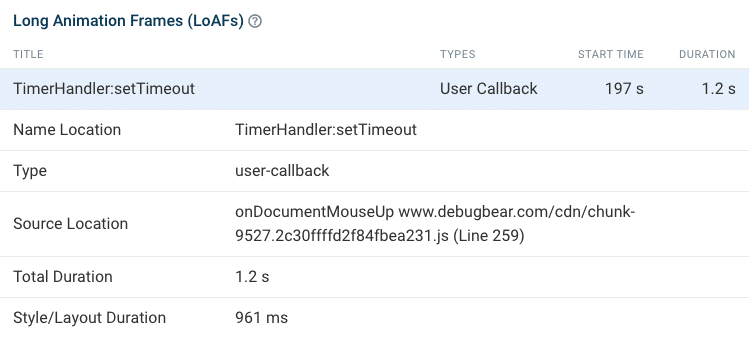
If your website supports the Long Animation Frames API, you’ll also be able to see specific scripts and JavaScript functions that are causing slow interactions for your visitors.

DebugBear INP attribution data

How do I know which page interactions are impacted by slow INP?

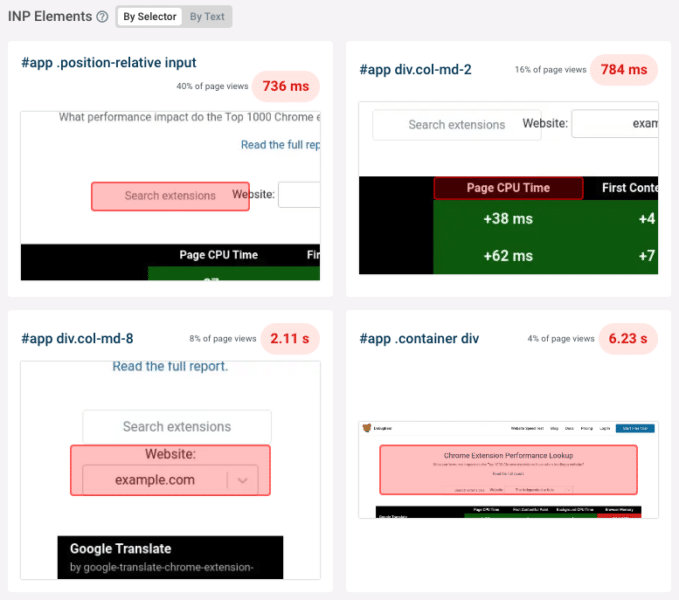
If you want to optimize your code and test interactions on your website, you need to know what elements users most often interact with on your website and which interactions often cause slow INP.

This isn’t data you can get from Google CrUX reports, but a dedicated Core Web Vitals monitoring tool like DebugBear will collect this information for you.

DebugBear INP element breakdown

You can filter the data by page, device type, and many other factors to better understand how visitors experience your website. DebugBear reporting can give you targeted advice on how to improve Interaction to Next Paint.

How to monitor Interaction to Next Paint and other Core Web Vitals

A real user monitoring (RUM) solution can help you get ready for the new Interaction to Next Paint metric and help you stay on top of your Core Web Vitals over time.

Try DebugBear with a free 14-day trial. Continuously measure your web vitals and see what pages would benefit the most from optimizations.

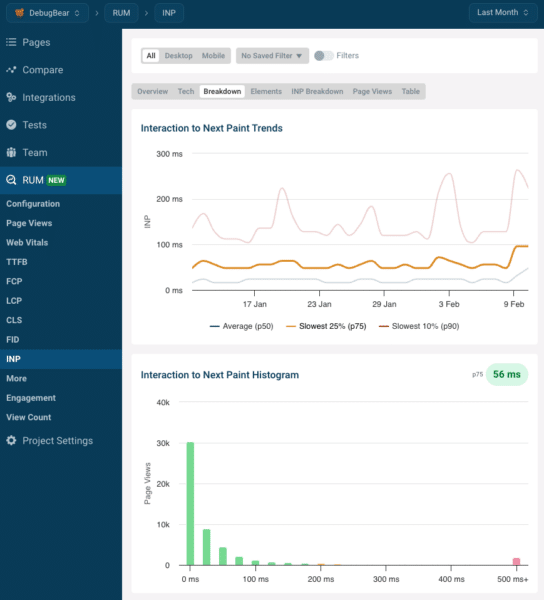
DebugBear INP trendline and histogram

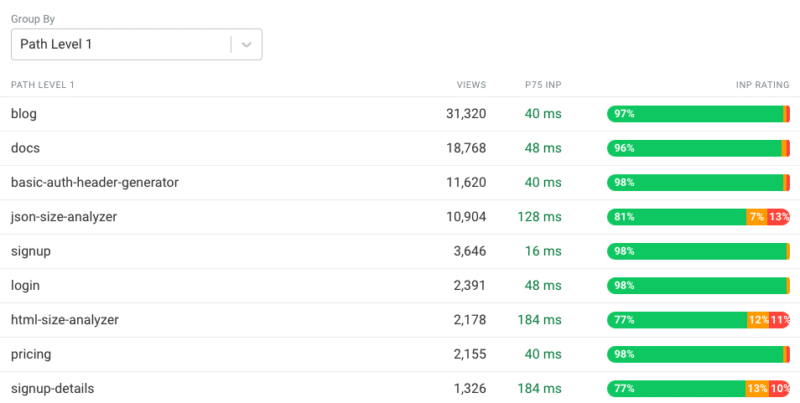
Simply install the DebugBear analytics snippet to gain insight into your visitor experiences. Avoid the 28-day delay that comes with Google’s web vitals data and get detailed reports you can use to deliver a better website experience and rank higher in Google.

DebugBear INP breakdown by page


from Search Engine Land https://ift.tt/GE6WoAi
via IFTTT

Google adds support for product variants and clarifies return fees

Google added new structured data to support product variants on e-commerce stores, this includes new technical documentation on how to implement the new structured data and Search Console and rich result testing tools for validation of the new markup. This is called product variant structured data.

Also, Google clarified when to use FreeReturn versus ReturnShippingFees as value for returnFees for product returns in the product structured data documentation.

Product variant details. Google explained that e-commerce sites “for variant products are more complex than single-product sites, and, consequently, the associated structured data is more complex as well. One added complexity is that variants must be grouped together under one “parent” product.” Google’s solution to allow such grouping of variants is by adding new support for the Schema.org ProductGroup type and three new properties:

  • hasVariant (to nest Product variants under their parent ProductGroup),
  • variesBy (to list the variant-identifying properties), and
  • productGroupID (the ID, also known as “parent sku” of the ProductGroup).

Also added a new isVariantOf property to the product structured data documentation and clarified that Google support product variants with distinct URLs.

Validation support. In addition to the new documentation, Google updated Search Console to support validation and error handling for this new structured data. Google said, “New validations for variants have been added to the Product snippets and Merchant listings reports in Search Console and Rich Results Test.”

Here is what that report looks like:

Return clarifications. As a side note, Google Clarified when to use FreeReturn versus ReturnShippingFees as value for returnFees for product returns in the product structured data documentation.

Why we care. If you run an e-commerce site and you have products that have product variants, such as by sizes, colors, materials, or patterns or different memory sizes, screen sizes, and processors, etc – then you will want to check out this new product variant structured data support.

Utilize the documentation and the testing tools and track any success in search with these implementations.


from Search Engine Land https://ift.tt/GDmQydP
via IFTTT